Agile Metrics
Agile Metrics
Because of its rapid nature and acceptance of frequent change, Agile projects are monitored using specialized metrics on a per-sprint basis to confirm alignment to project constraints (scope, schedule, and cost) and to demonstrate progress more effectively. These metrics are:
|
Metric |
Definition |
What it Measures / How it is Used |
|
Effort |
Quantity of Hours spent completing a task |
Measures productivity of team by incorporating available time vs time spent |
|
Capacity |
Quantity of Hours available for coding in a given sprint |
Measures productivity of team by incorporating available time vs time spent |
|
Velocity |
Measure of pace to complete work within a defined period of time (sprint) |
Story Points that measure integration of complexity and effort to complete complexity |
|
Happiness |
Indicator of how the team feels about the work. |
At the end of the Sprint, each team member answers four questions:
This Agile metric brings the human, emotional side of any changes or struggles the team faces to the surface, which is impossible with the other metrics. Teams can adapt the exercise above with whichever questions make most sense to them. |
|
Cycle Time |
How long it takes a team to complete a task |
You can single out any items with an anomalously high time to completion for further discussion. Cycle time is a helpful metric because it conveys a lot of information about: Productivity: Teams with short cycle times complete more items than teams with longer cycle times. Story size: When task or story sizes are small, Cycle Time goes down. It can help identify issues where a team is taking on chunks of work that are too big. Predictability: Teams with consistent cycle times can give more reliable forecasts on how long it takes them to complete work. Delays: Teams with increasing or varying cycle times can use the number to identify where and why delays happen. Time to feedback: The longer a team’s Cycle Time, the longer it takes to get feedback from customers on product updates. Cost: Almost without exception, longer Cycle Time equates to higher development costs. Cycle Time was by far the most popular Agile metric selected by Agile Coaches, Scrum Masters, and other Agile practitioners. |
|
Lead Time |
The entire period a work item spends in process from the moment it is added to a backlog. Essentially it is CT plus time the task/story sits around in the backlog waiting to get pulled into WIP phase. |
A focus on Lead time keeps the Backlog lean and clean. It is critical when we use the Backlog for prioritization and planning since we could have dozens or even hundreds of stale backlog items hanging around there. |
|
Work In Progress |
Total number of items a team is working on at any given time |
WIP is a critical metric for keeping teams focused and ensuring a continuous flow of work. Teams can calculate this by noting how many items sit in the WIP or “In Progress”.
WIP is especially powerful when teams take a Kanban-style approach and set a maximum number of items they can have in progress simultaneously. This limit forces prioritization discussions. When someone wants to add a new item to the WIP column, they need to make space for it by finishing another task first or moving one to the Product Backlog. |
|
Escaped Defect Rate |
|
The Escaped Defect Rate can be a good prompt for diagnosing problems and suggesting improvements |
|
Cumulative Flow Diagram |
Pulls several metrics into one visual |
The x-axis in a CFD represents time, the y-axis represents work items, and each graphed series represents a stage of the work process. Through this visualization, we can instantly grasp how work is flowing through a system.
Bands that narrow (bottom left graph) signal you have too few tasks, since items get completed faster than new ones arrive. We can also measure the distance between two horizontal points, for example, to get Cycle Time. Do that vertically, and we can check WIP at any point in time covered by the CFD. |
|
Throughput |
Throughput is the number of work (WIP) items the team completes in a specific period, usually measured per Sprint. |
This metric is different from Velocity, which measures the number of story points delivered per work cycle. Since one work item usually represents multiple story points, the numbers differ. As you measure average Throughput over many Sprints, the metric helps predict how many completed features or user stories a customer or other stakeholder can expect each Sprint. A low Throughput can also indicate other issues, for example, that your team’s user stories are too big, which is a signal to start Story Splitting or to more broadly consider whether there’s a deficiency in the way your team estimates Story Points. |
|
Blocked Time |
Blocked time counts the time a work item can’t move forward, usually caused by a dependency or other issue outside the team’s control. |
Categorize blocked items by causes, then add up and track the total blocked time for each category to get a sense of persistent problem areas. This gives teams clear data from which to prioritize improvements. Blocked time can be a great way to figure out bottlenecks and the root cause of delays. Such insight sometimes provides opportunities for improvement outside of the team’s direct control. |
|
Story Points |
A numeric value estimate assigned to each user story from a Fibonacci sequence 1-2-3-5-8-13 |
Establishes a relative size of the user story vs. the rest of the user stories in the backlog by factoring in size, complexity, and risk while avoiding typical inaccuracy in human time estimating |
|
Ideal Hours |
A numeric value estimate assigned to each identified task in terms of real “heads-down” work to be done for the task |
Establishes a baseline against which to track progress on particular tasks related to a specific user story A Scrum member’s daily capacity in ideal hours is assumed to be 75-80% of total work schedule hours to account for time spent in meetings, planning, or troubleshooting related to the task Unlike estimates for scope items, tasks should be small enough that the risk of over/underestimating is reduced so hours are appropriate |
|
Sprint Burn Down |
Daily calculated value of the total remaining ideals hours vs. the total estimate for the Sprint |
Tracking vs. an ideal linear decrease in remaining hours to zero helps determine whether the Scrum team is "on schedule" to complete all tasks for the given iteration |
|
Sprint Burn Up |
Daily calculated value of the total accepted story points vs. the planned/targeted story points for the Sprint |
Tracking vs. an ideal linear increase in story points to the scoped total can help a team determine whether their stories are the right size (i.e. small) to get acceptance early and often A flat total scope line should be maintained for the Sprint to prevent scope creep within Sprints |
|
Sprint Velocity |
Actual value of story points accepted by the end of the Sprint |
Measures Sprint throughput in story points Measures team’s ability to deliver on a Sprint-to-Sprint basis to aid in future planning and delivery date estimation |
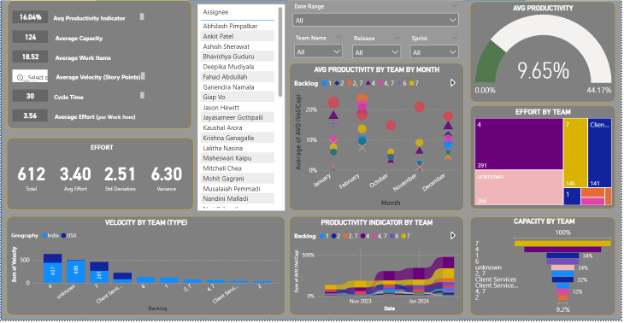
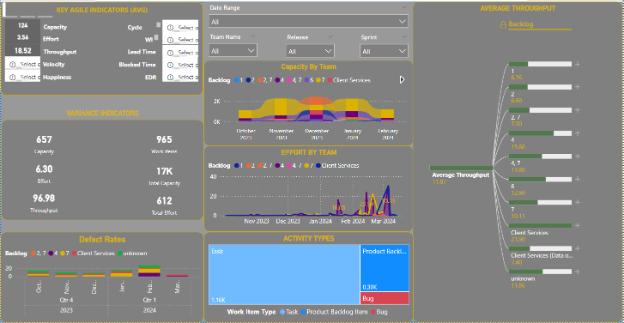
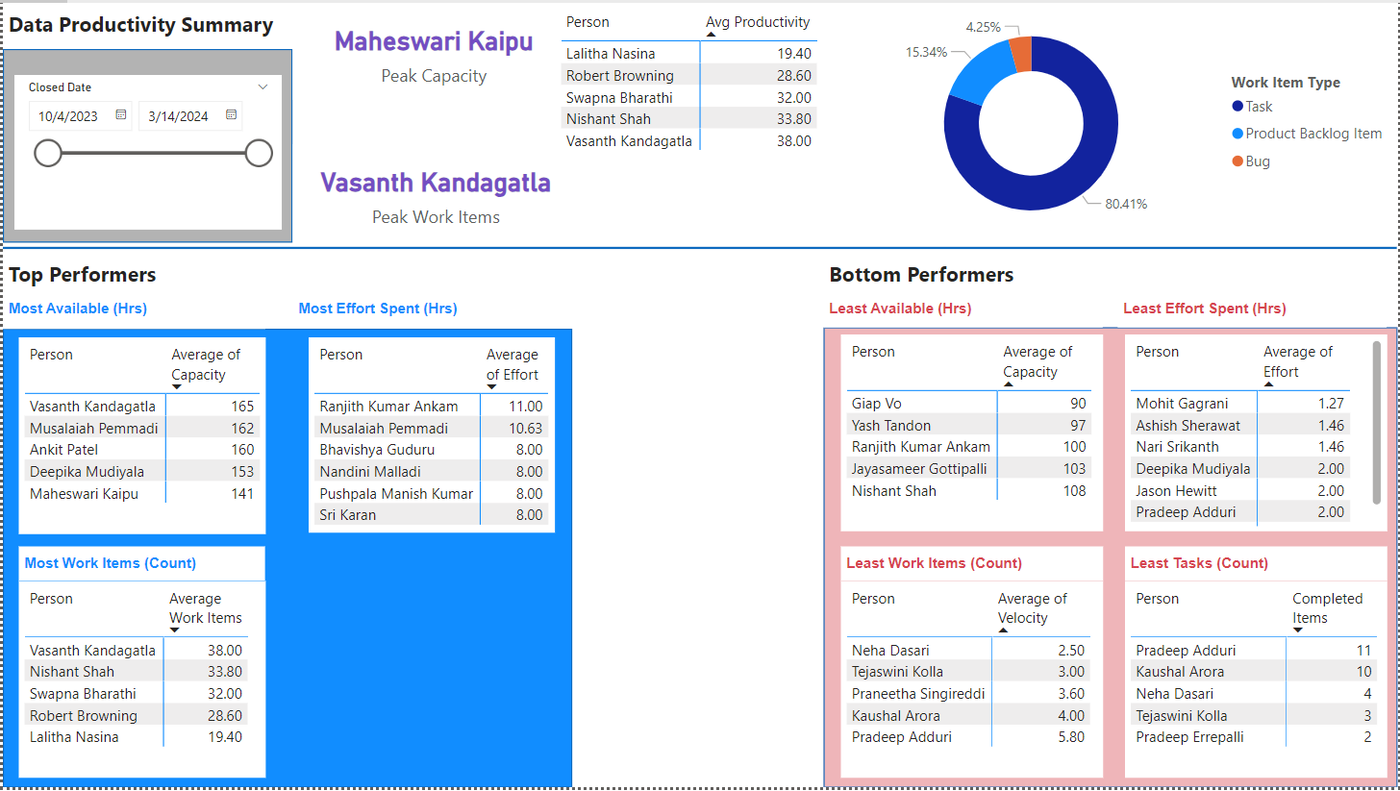
Example Dashboards of Agile Metric and Productivity Dashboards